Appearance
Diagrams
Each diagram represents a particular piece of the model and the various conditions or states that this piece of the model can be in. These pieces correlate to aspects of traditional PRA modeling and range from small-scale components to a large scope, overall plant response and design. The scope of the diagram indicates the type of diagram: Single State or Multi State. The single state or multi state type indicates whether or not the diagram can be in multiple states at once or not. A diagram contains multiple states with the events that can occur, actions that can be executed and variables used. These all define how the simulation may sift through the diagram over time. Single State diagrams can also be evaluated to a Boolean depending on which state they are currently in. This is a main feature that when combined with a Component Logic Event, can greatly simplify a model. Unlike the more general Multi State diagrams, these diagrams are restricted to only be in one state at a time, in order to execute the evaluation process.
Creating a New Diagram
In the left Navigation Frame, right click on "Diagrams" and select "New Diagram" from the drop down menu. 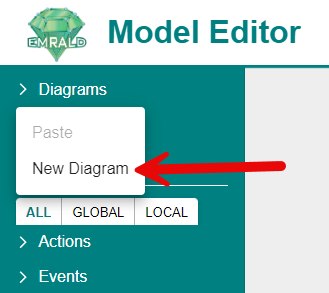
Or select "New Diagram" from the right side drop down menu. 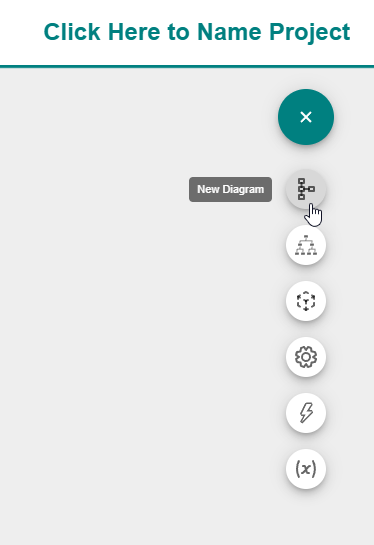
There are three options when filling out the form, all seen in the properties window. 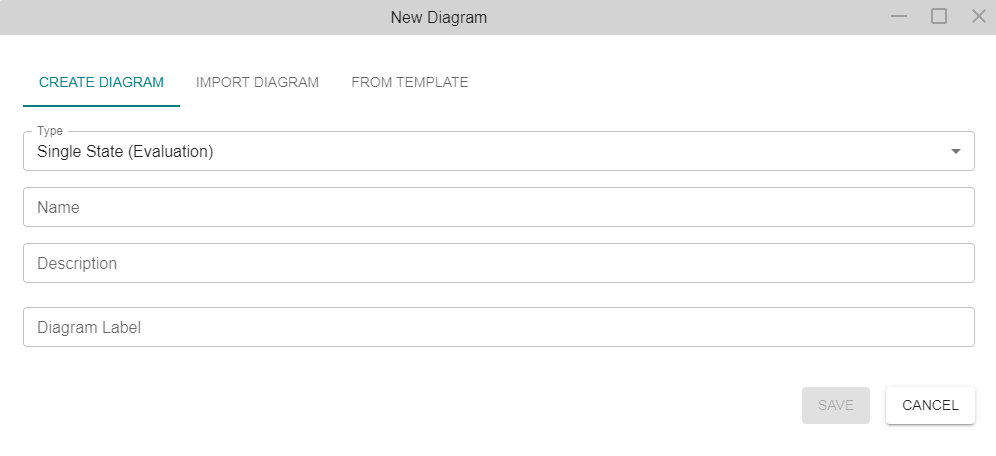
Option 1 (Create Diagram): Fill out the dialogue box. A description is optional. Click the Type dropdown menu to select the type of diagram you would like to create. The different types are Single State and Multi State. More information on these types are in the Types of Diagrams section. Ensure the correct type of diagram is selected as switching between diagram types can sometimes cause errors due to the differing modeling options.
After entering the diagram type, name, and optional description, you must enter the diagram label. This is the group the diagram will be under in the Left Navigation Frame. If you want your diagram to be part of an existing group, then enter the existing group name for the label exactly as it appears in the Left Navigation Frame. If you want your diagram to be in a new group in the Left Navigation Frame, then enter a unique name for the diagram label. 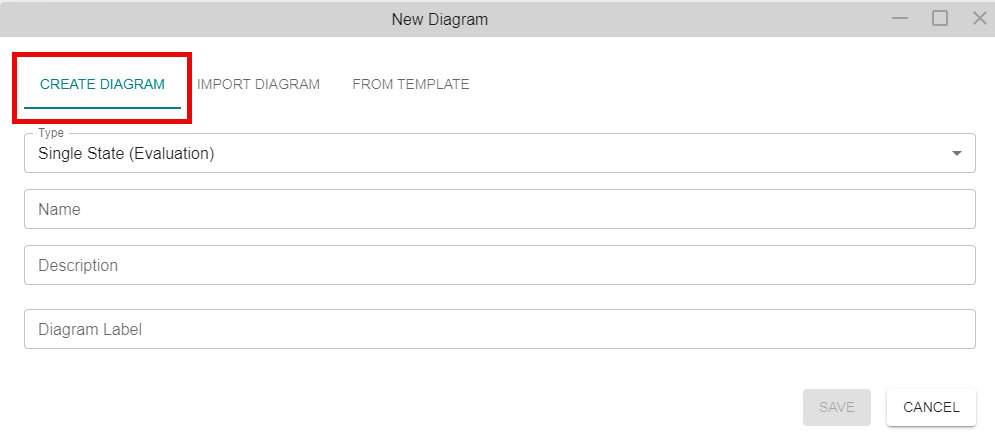
Option 2 (Import Diagram): Click "Choose File" to import an existing diagram from another project. See the details for Merge in the Top Menu Bar section for instructions on how to resolve conflicts if there are any. Note that when importing a diagram, you will be directed to a conflict resolution screen even if there are no conflicts. Diagrams can only be imported from project files that have only one diagram in it. If you would like to import more than one diagram at a time, see the details for Merge in the Top Menu Bar section. 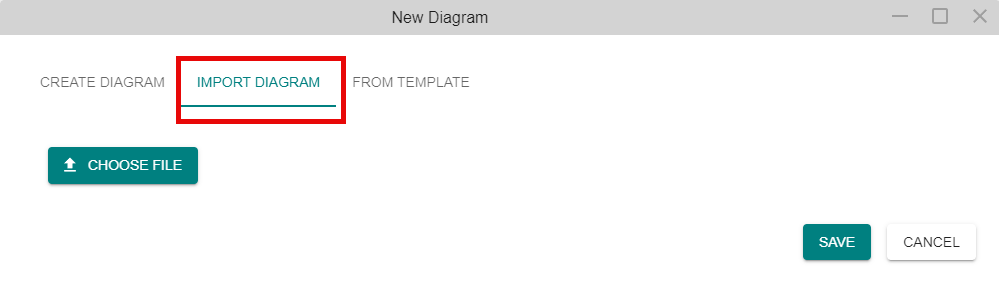
Option 3 (From Template): Click "From Template" to create a diagram that is modeled off of a previously built template. Click one of the created templates shown on the right-hand side and click "Save". For more information on creating and using templates, go to the Templates section. 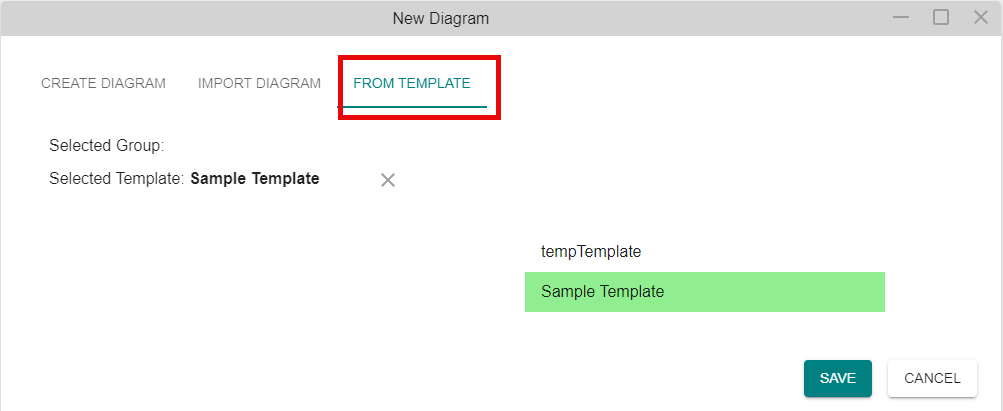
Continued for All Options: Once you have completed filling the fields, press "SAVE". The diagram will appear in the left navigation frame. If the diagram was created from a template, it will be in the same category as the diagram it was made from was in.
Editing a Diagram
Edit the Diagram Model
On the Left Navigation Frame, click on "Diagrams" to expand the menu. Double-click on the folders to expand them to reveal the individual diagrams.
Option 1: Double-click on the individual diagram to open it in the Modeling Area.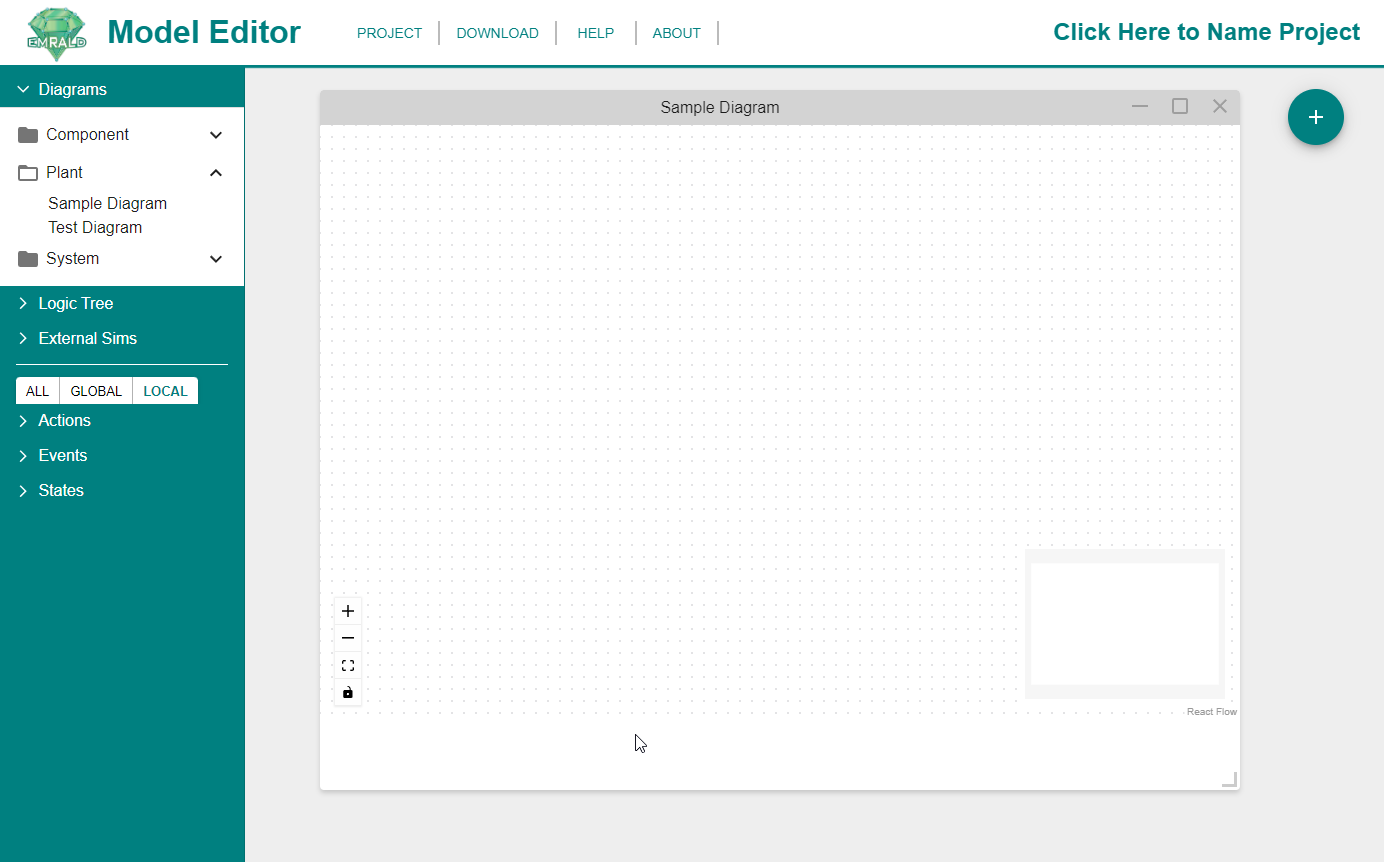
Option 2: Right-click on the individual diagram then click "Open..." to open it in the Modeling Area.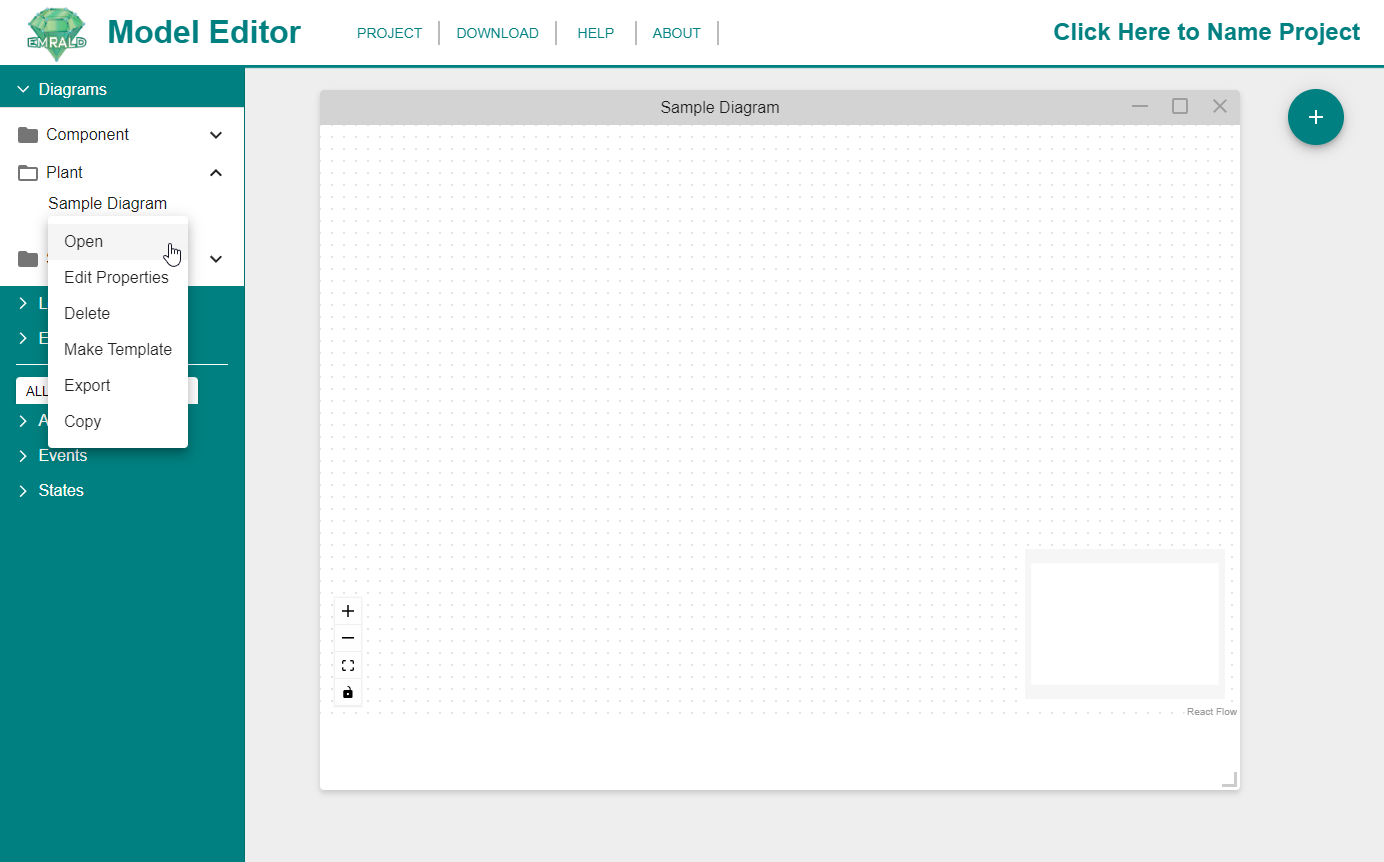
Edit the Diagram Properties
As shown in Option 2 of Edit the Diagram Model shows, right-clicking on the individual diagrams will open a menu. Click on "Edit Properties..." to edit the basic properties of that diagram. The same dialogue box that opened in the Modeling Area when the diagram was created will appear again and changes to the name, description, and type can be made.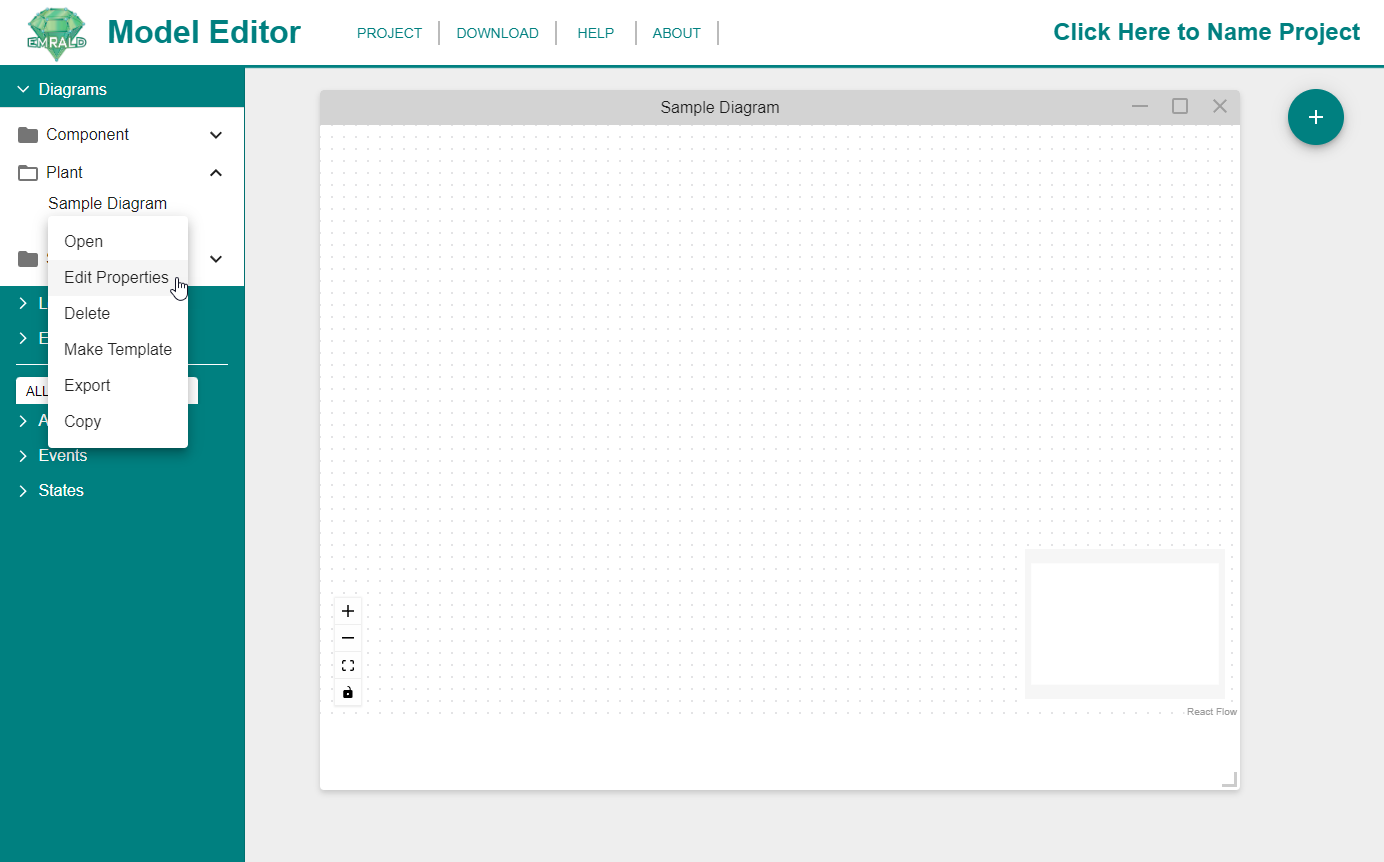
Deleting a Diagram
If your diagram is open in the Modeling Area, first close it by clicking on the [X] in the top right corner of the Diagram window. On the Left Navigation Frame, right-click on the individual diagram and click on "Delete" in the menu that appears.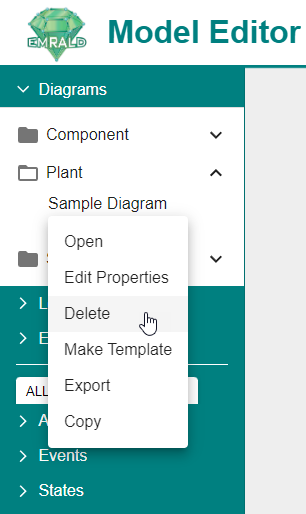
A confirmation window will appear in the Modeling Area. Click "Yes."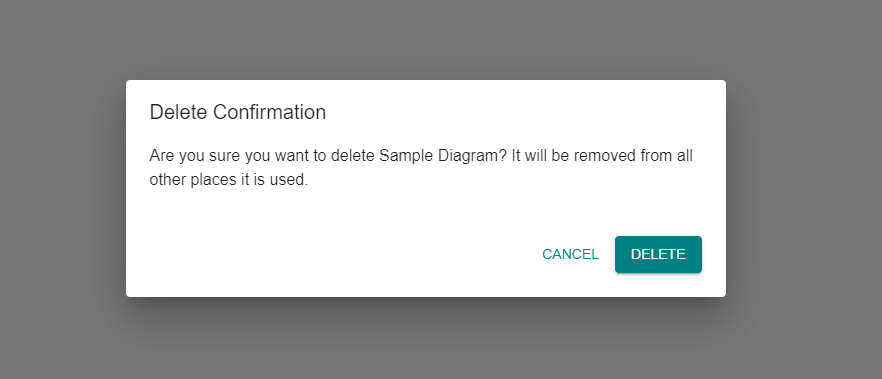
The diagram will be deleted and no longer be listed in the Left Navigation Frame.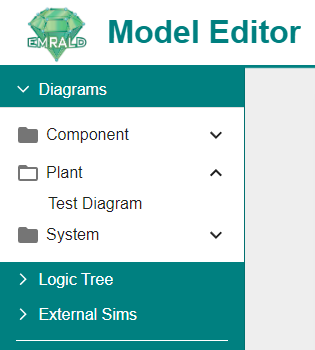
Elements of a Diagram
States
States are a logical representation for a current condition in a diagram represented by the rectangular blocks. They contain events and actions that perform tasks or direct the simulation to other states.
See States for more information.
Events
Events monitor for specified criteria and can have one or more actions that are executed when that criteria is met.
See Events for more information.
Actions
Actions change the properties or cause movement through a model during a simulation run.
See Actions for more information.
Arrows
Arrows indicate movement from one state to another. Solid Gray arrows indicate that the state exits the current state and moves to the new state upon completion of the action. Dotted green arrows indicate that the simulation will not exit the current state, but will add the new state as a "Current State" in the model.
Types of Diagrams
The following diagram types correspond with traditional PRA modeling. The key difference in the types of diagrams is if the diagram can only be in a single state or multiple states concurrently and the ability to evaluate for a boolean value.
Multi State
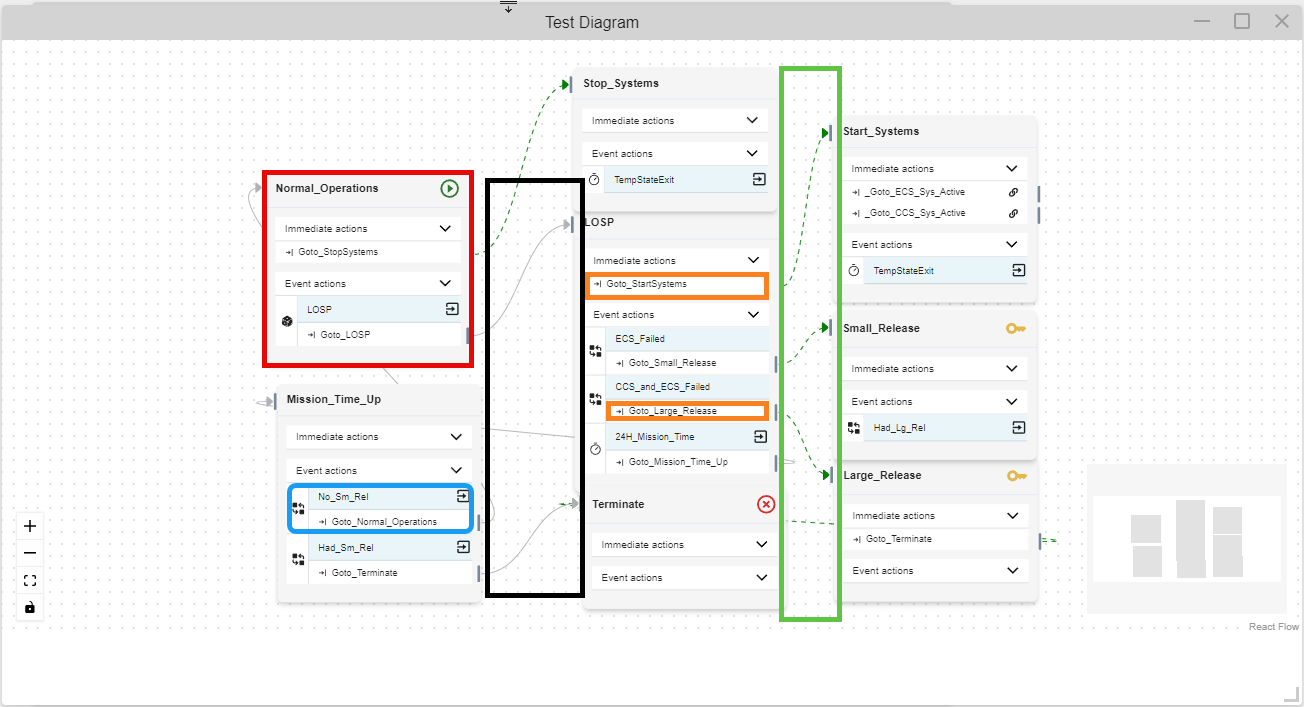
Multi State diagrams, also known as Plant or Plant Response diagrams, are the main scenarios to be evaluated, similar to Event Trees in traditional PRA. These diagrams are "Multiple State" capable, meaning that you can be in multiple states at the same time. They typically have a starting state such as "Normal Operations" shown in this diagram. Other states can do general evaluation and movement or can be a key end state. Here the user defines the various states and events that drive the simulation from an initiating event to a desired key state or ending of the simulation.
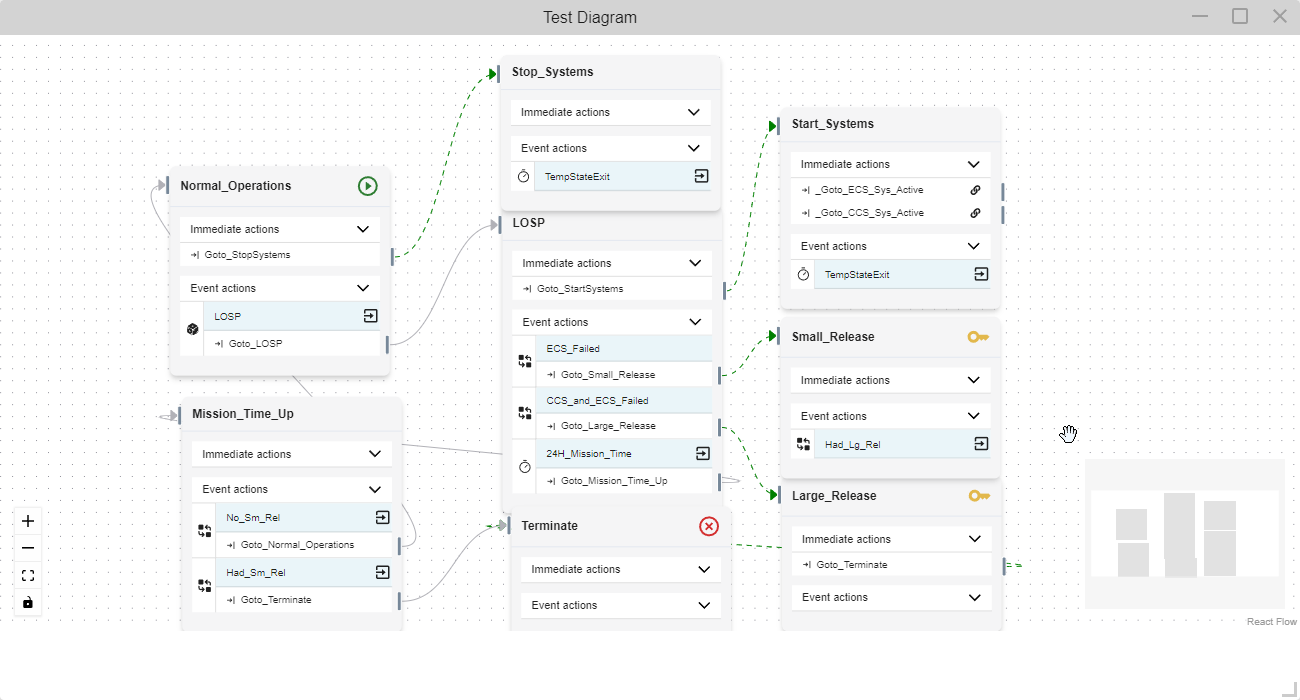 In this example, we are looking for the key states of "Small_Release" and "Large_Release". (See Key States under [States](/Modeling/states.md) for more information) The model starts in "Normal_Operations" and waits for a loss of offsite power "LOSP". When in "LOSP" three things can happen, ECS can fail, CCS and ECS can fail, or 24 hours can pass. These events cause the transition to the corresponding states and then the simulation will terminate.
 Single State
Single State diagrams are meant to be small diagrams for capturing all behaviors of individual components. All basic events for components in traditional PRA can be captured in a single state diagram. Single State diagrams means you can only be in one state at a time and that a boolean value is associated with the different states. At least one state must have a "0" value and at least one state must have a "1" value assigned. (See the Single State Diagrams subsection in State Properties for more information.)
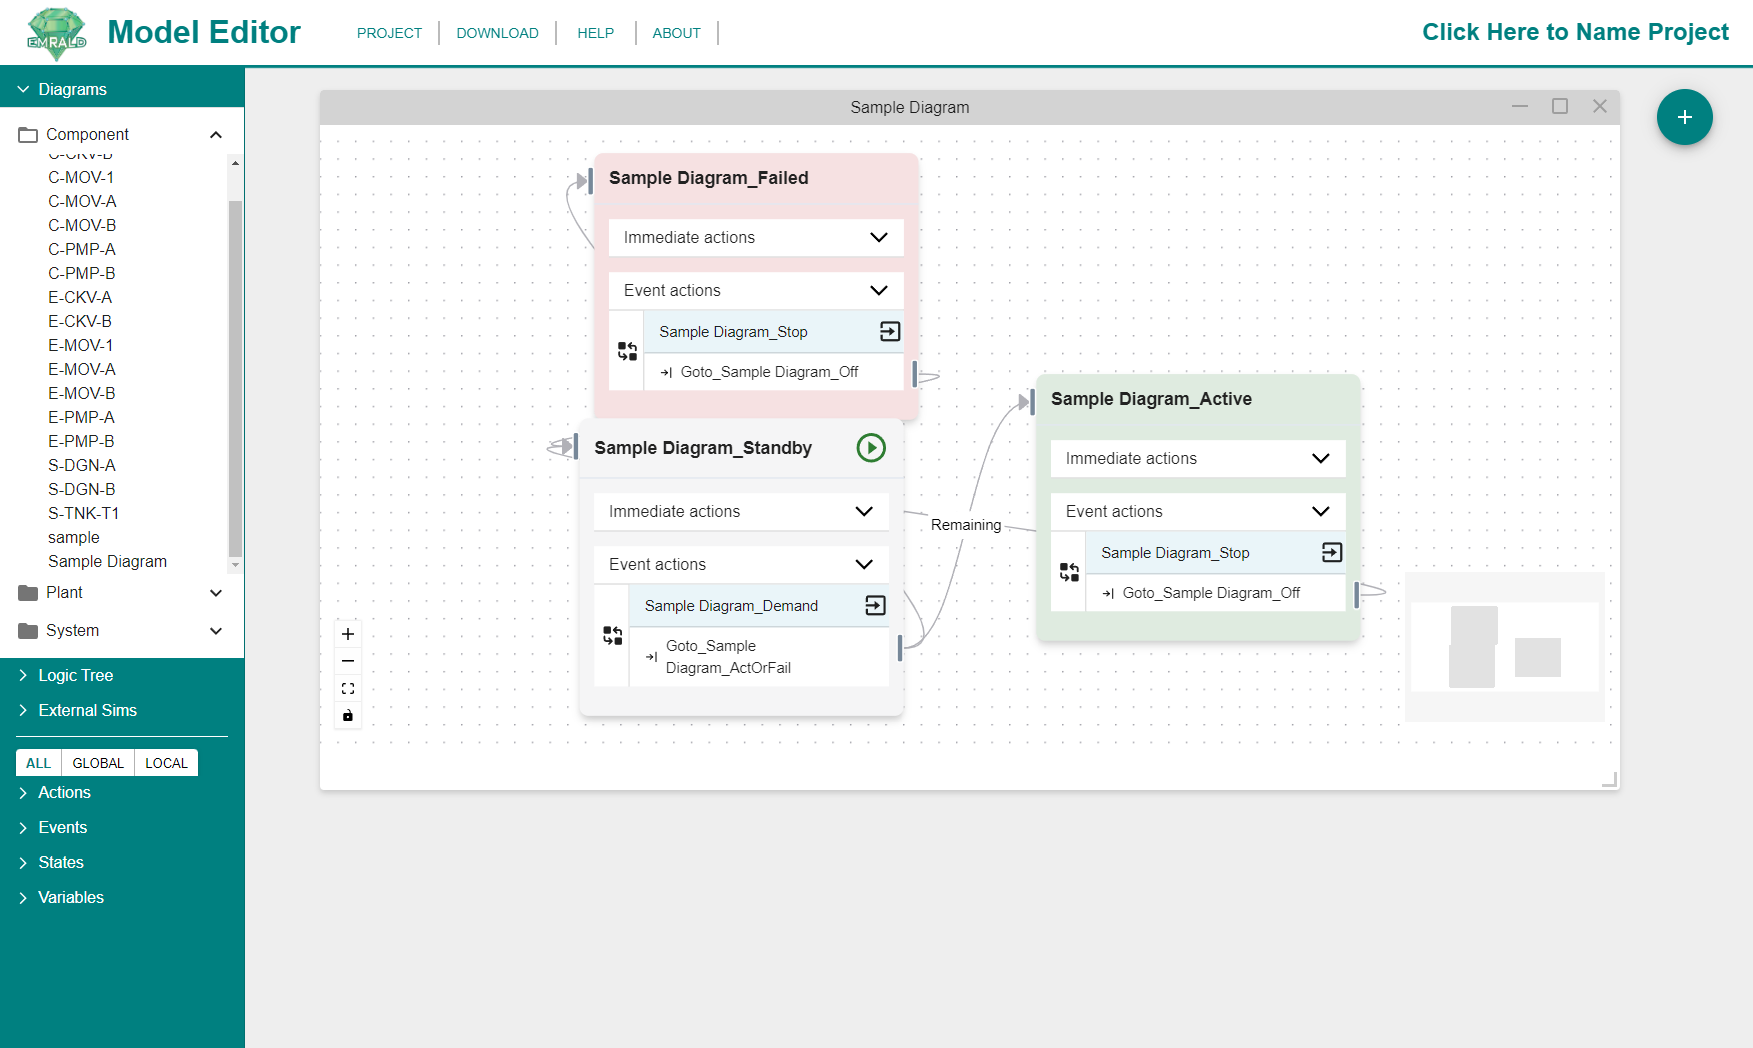
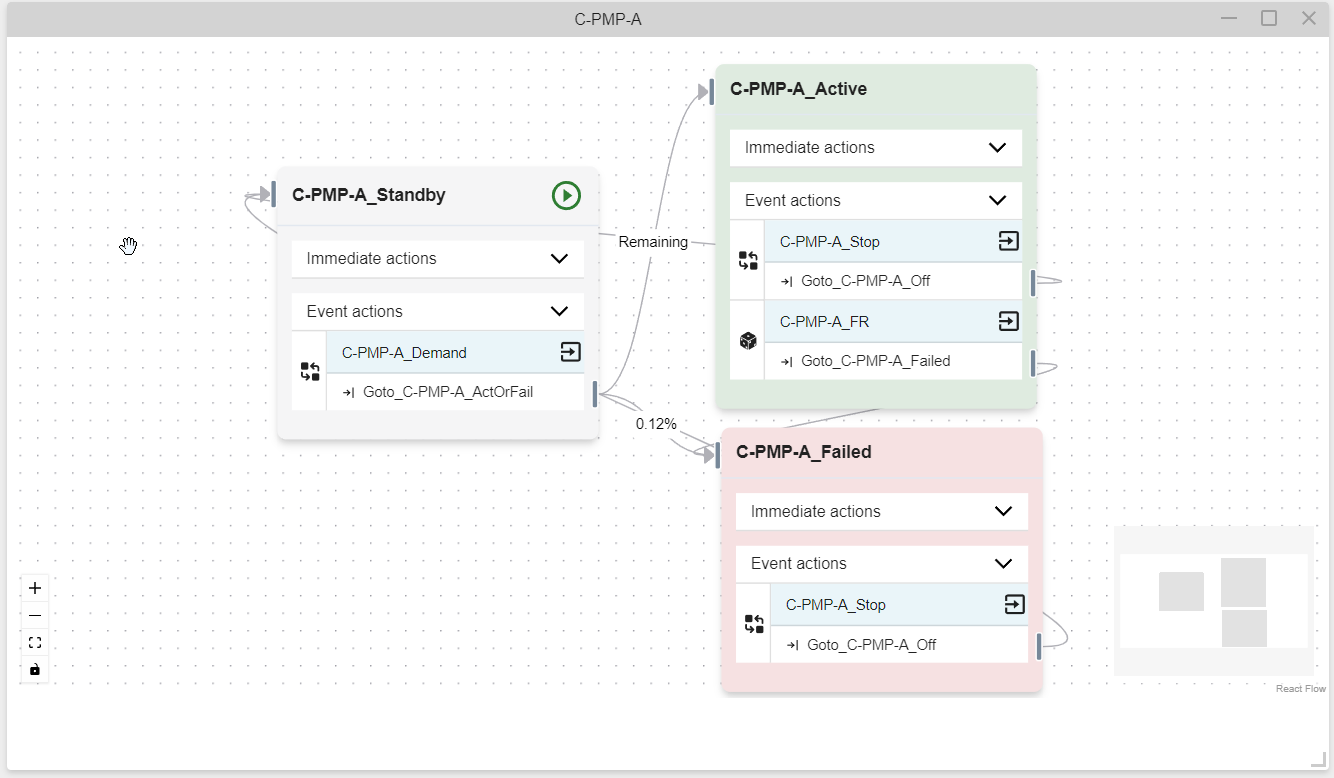 This example is a pump that has three states, standby, active and failed. When the demand event for the pump's use is triggered, the pump either moves to active or failed depending on random sampling. This would be equivalent to a "Fails to Start" basic event in traditional PRA. When in the active state, a failure rate event would sample and determine when the pump will fail and move to the failed state. This is equivalent to a "Fails to Run" basic event in traditional PRA. In this example, a stop event resets or returns the pump to the standby state.
 Key Points
- PRA Basic Events are captured as events in the single state diagram states.
- Events can be shared between different single state diagrams (common cause).
- Single state diagrams are diagrams in which the simulation can only be in one of those states at any given time.
- Each State has a Boolean evaluation value, which can represent things like OK or Failed.
System and Component Diagrams
Two main types of single state diagrams are Component and System diagrams. A component diagram is a traditional single state diagram that can always be evaluated as a boolean depending on the active state. System diagrams function just like a component diagram, but with some unique characteristics. However, both component and system diagrams are Single State Diagrams and have a boolean evaluation.
A system diagram only needs two states, active and failed. The work is done using a "Component Logic" event that evaluates a model of the components for the system. See Logic Tree for more information. 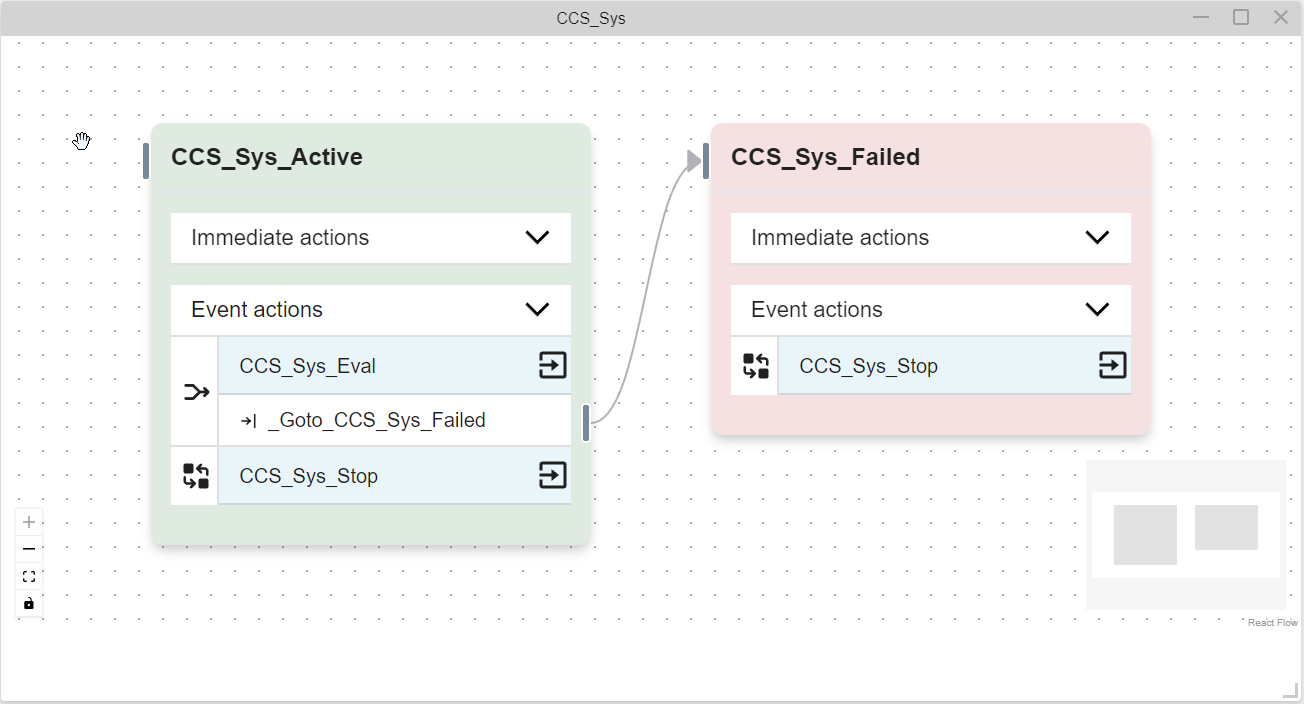 In this example, the CCS system has two states, active and failed. The associated boolean logic tree is evaluated whenever a change is made and if the tree evaluates to a "0," it moves to the failed state.