Appearance
EMRALD Solver
While the EMRALD Model is built in the web-based application, the actual simulation and solving of the model is done in an external application. This solver runs Monte-Carlo type statistical simulations.
This application can be downloaded from the EMRALD web-based model editor.
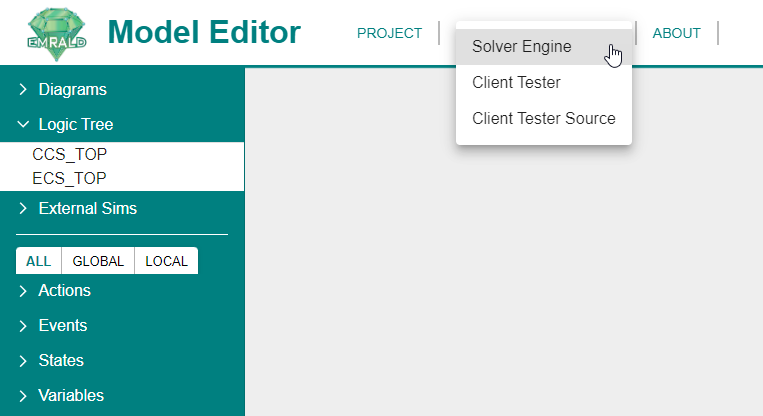
File > Open
The only file option in the solver is Open. 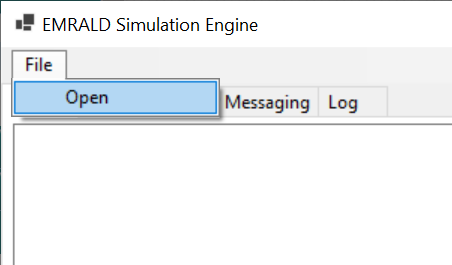
This will open a file explorer in which you can navigate to your model file. Select it then click "Open" to load the model. 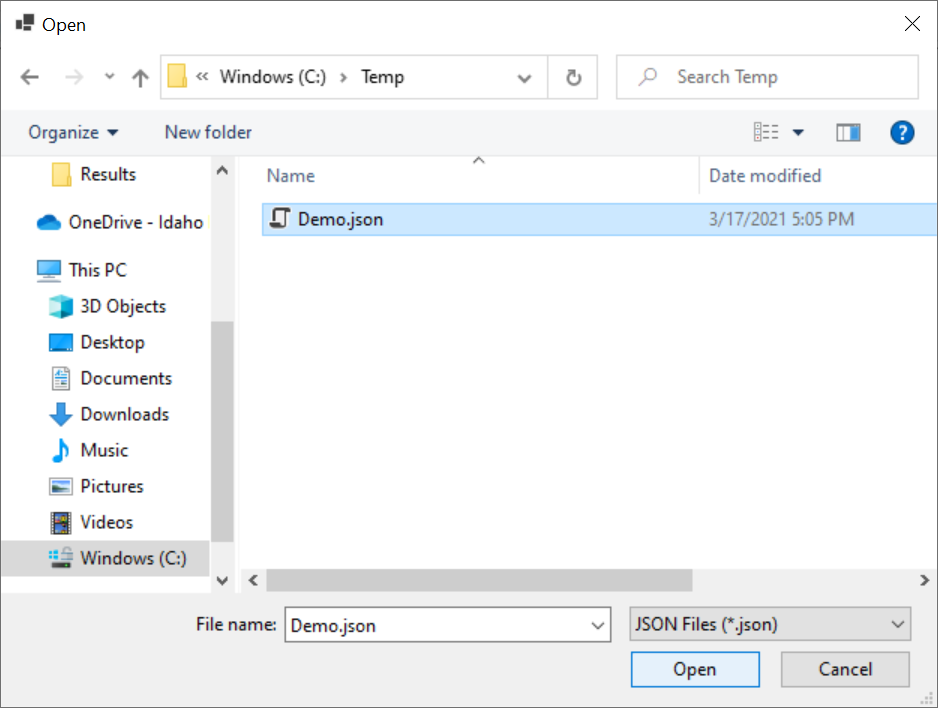
Model Tab
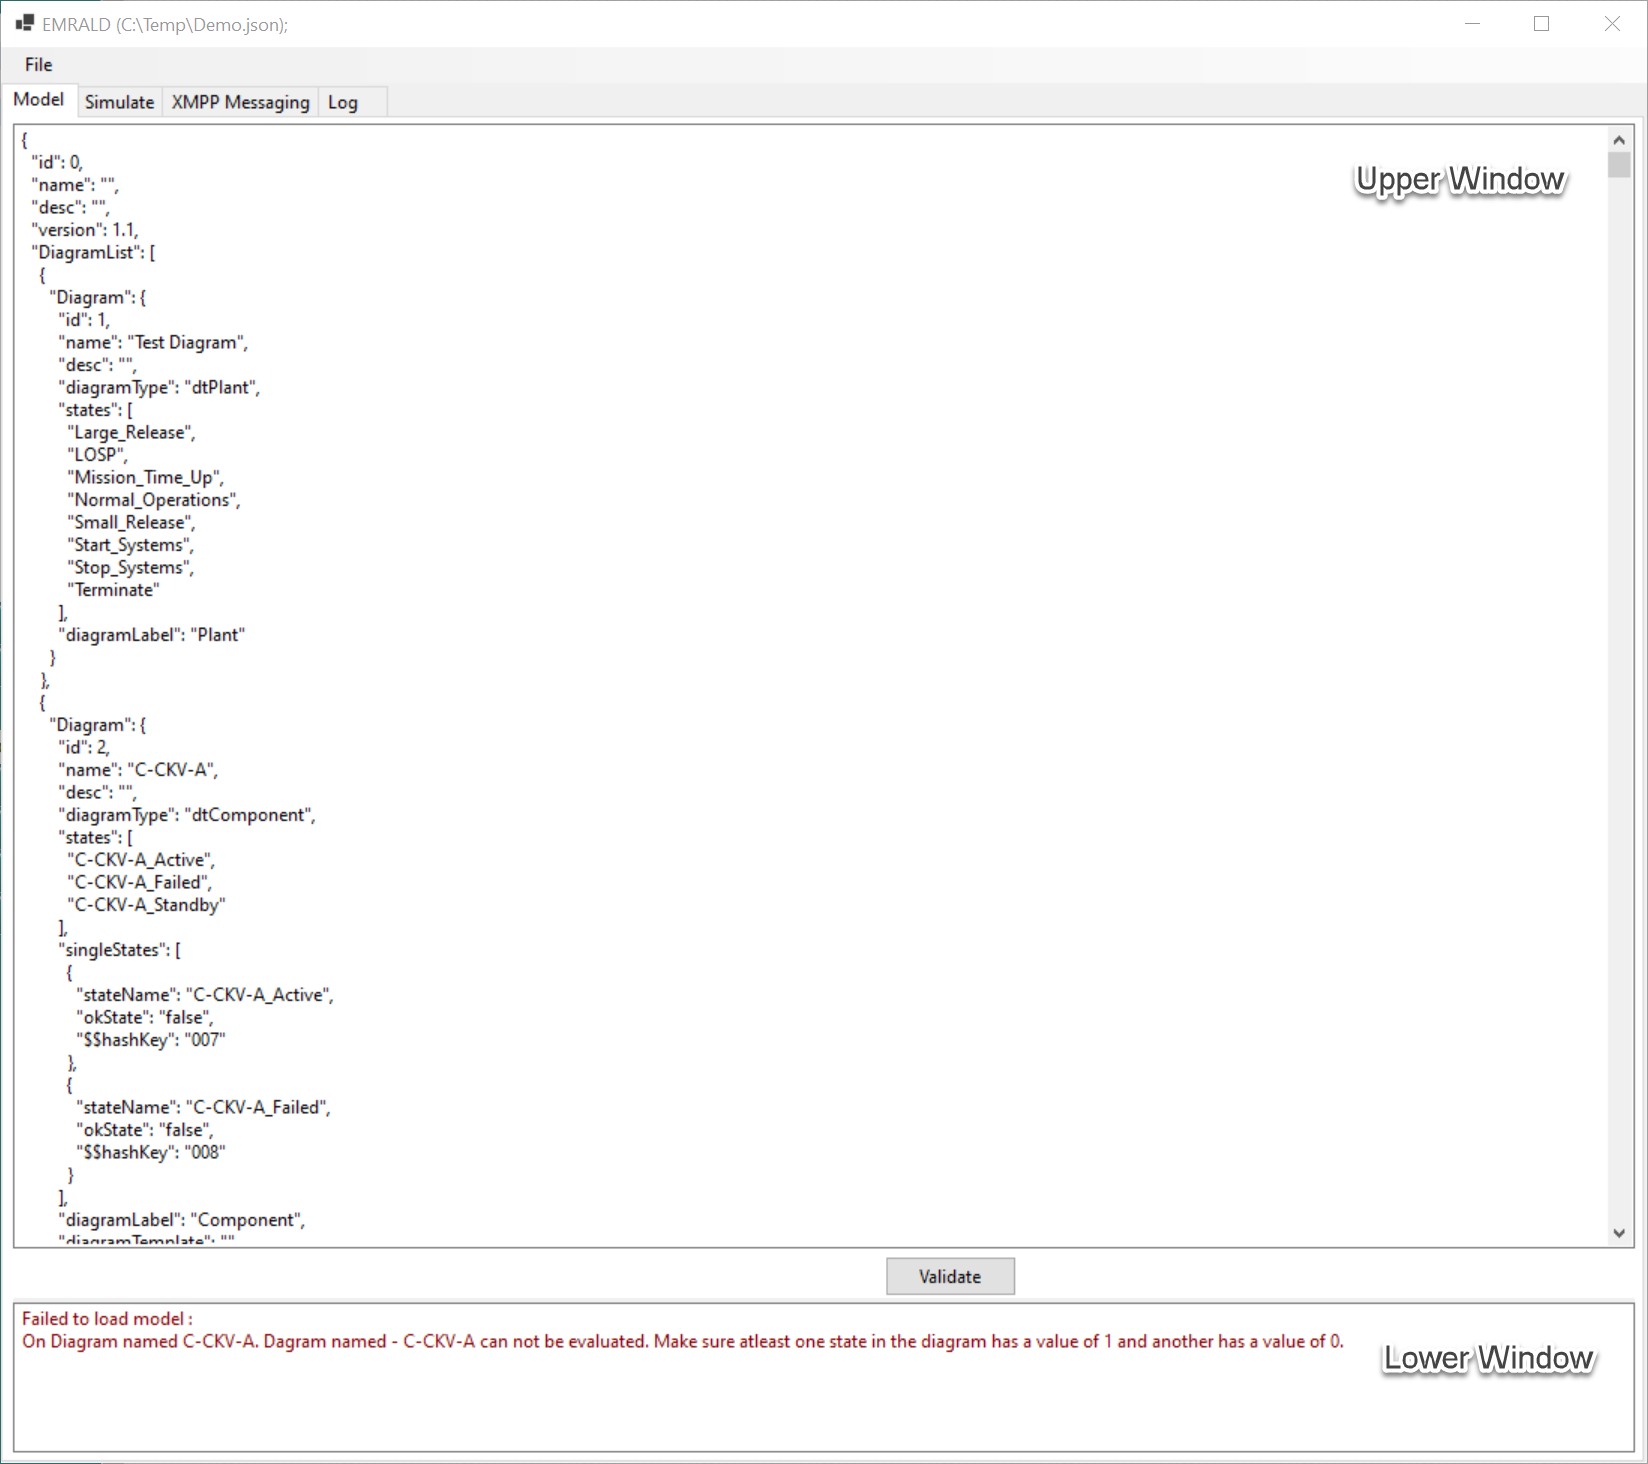
The model tab should be the window that is open upon opening the solver. After opening your file, the json script for your model should be displayed in the upper window.
The lower window displays warning messages about errors in the model. After opening the model file, if there are errors, an error should populate this window immediately. It will only display one message at a time so once it is fixed, the model will need to be validated repeatedly until all errors are addressed.
If it does not display an error, click the "Validate" button. If it still does not display an error, your model does not have any technical errors and can be run. See what an errorless model looks like below. 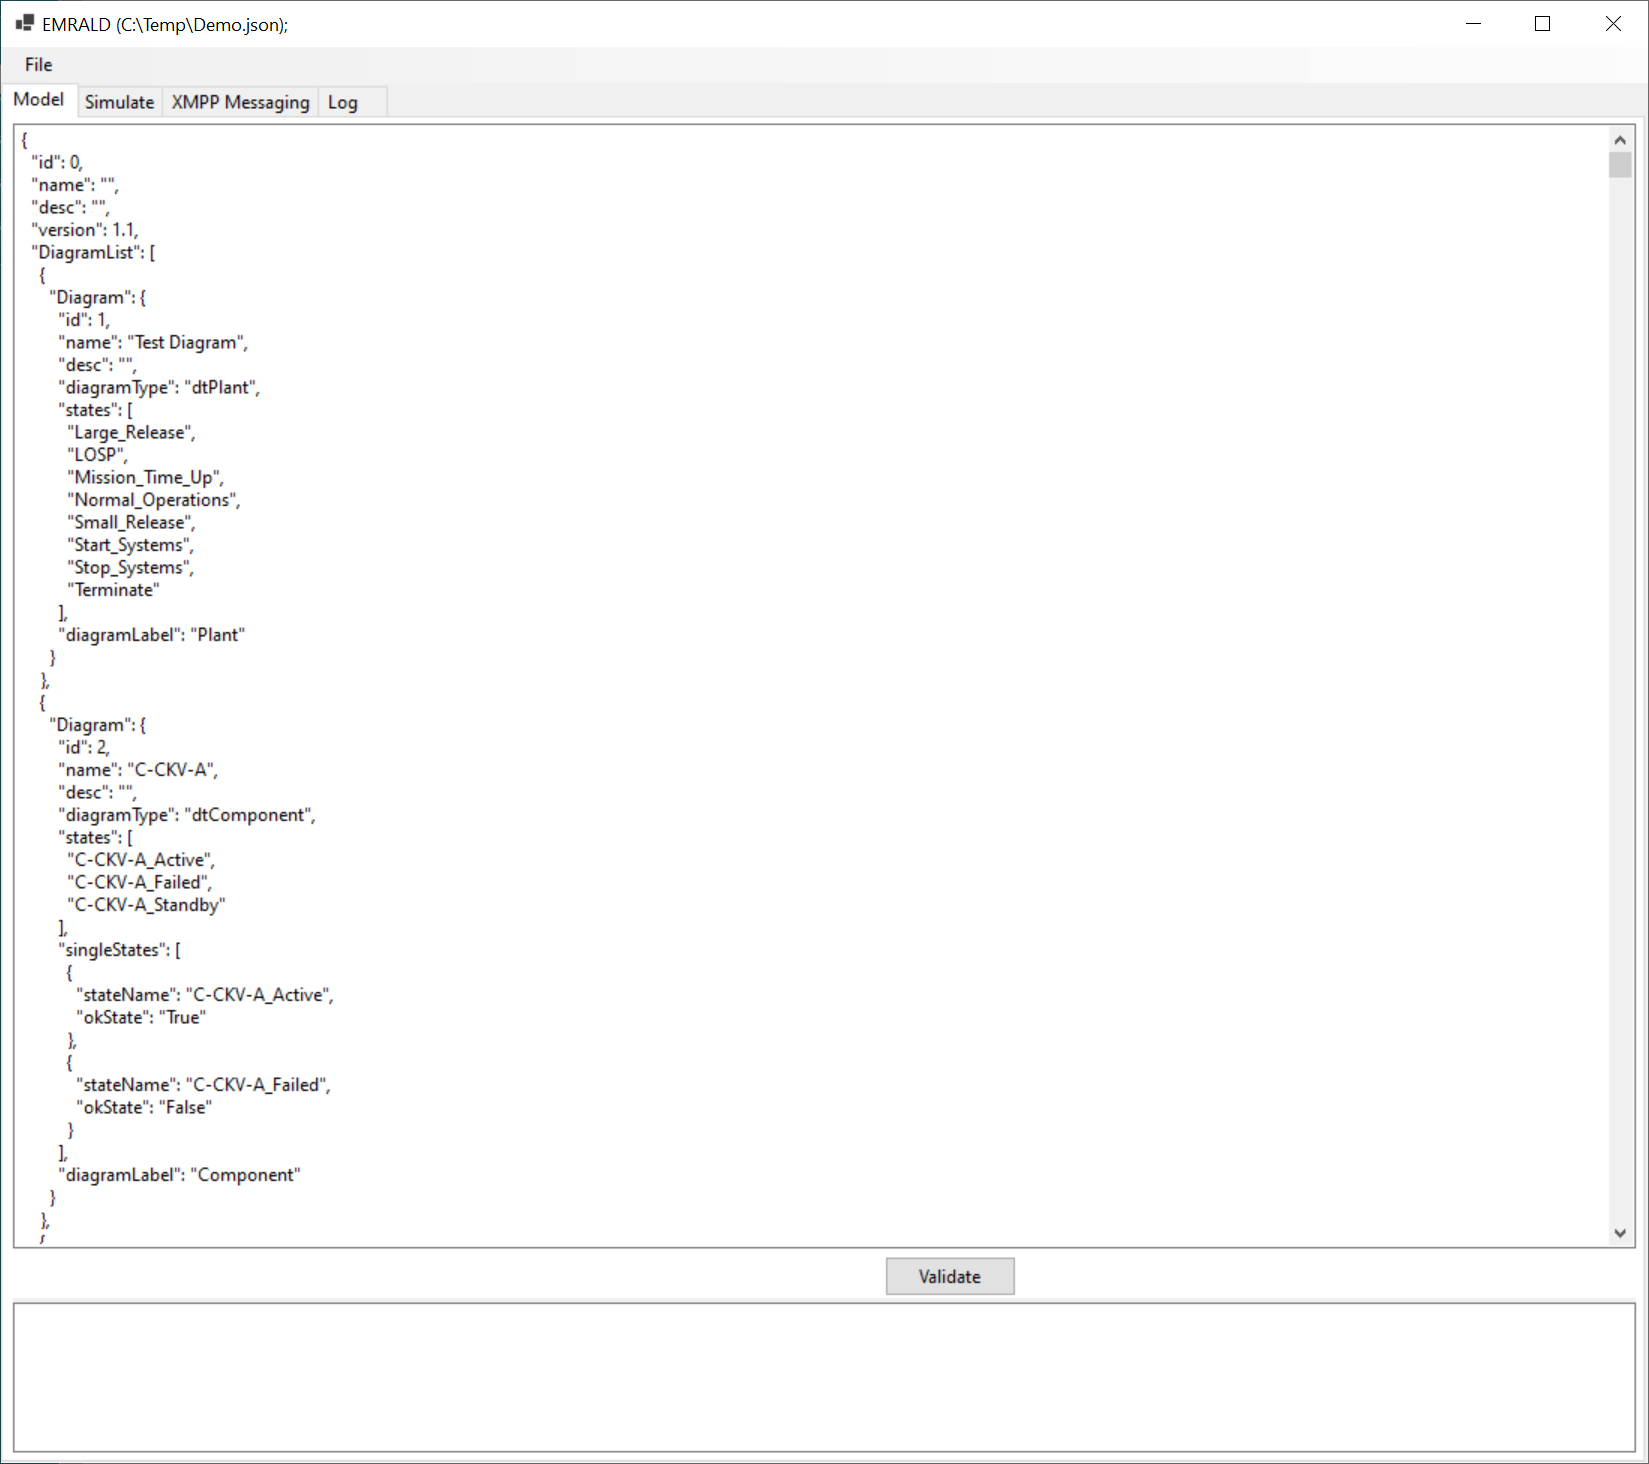
NOTE
Before opening a file in the web-based model editor to fix an error, close the solver. Not doing so will cause you to be locked out of the file since it will be simultaneously open in the solver. Once it is open in the solver without any errors, it will be ok to also load into the web-based model editor.
Errors displayed are only errors that make the model technically incorrect such as fields being left empty or a syntax error within coded sections. They are all structured to say that the solver, "Failed to load model", then it identifies what Event, Action, or other piece is incorrect, and finally states what the error was. Some examples of error messages and how to fix them are tabulated below.
| Error | Fix |
|---|---|
| Failed to load model : Event "Check_Consecutive" -failed to compile code - Ln(0) The left-hand side of an assignment must be a variable, property or indexer return ((Current - 1) = Previous); | Use proper syntax, change code in Variable Condition Event "Check_Consecutive" to: return ((Current - 1) == Previous); |
| Failed to load model : Action "Add" - failed to compile code - Ln(0) The name 'V1' does not exist in the current context return (V1 + V2); | In the Change Variable Action "Add", the checkbox for V1 as a used variable was not checked. Check it to include it. |
| Failed to load model : Action "Update_Current" - failed to compile code - Ln(-5) The type 'Act_Update_Previous' already contains a definition for 'Current' return (Current + 1); | In the Change Variable Action "Update_Current", the checkbox for Current does not need to be checked since it is the variable being changed and is already declared from selecting it from the dropdown menu as the variable to be changed. |
| Failed to load model : On Diagram named Component1. Diagram named - Component1 cannot be evaluated. Make sure at least one state in the diagram has a value of 1 and another has a value of 0. | Select the radio button on the States Properties editor as True or False for at least one state each in the component diagram. |
Simulate Tab
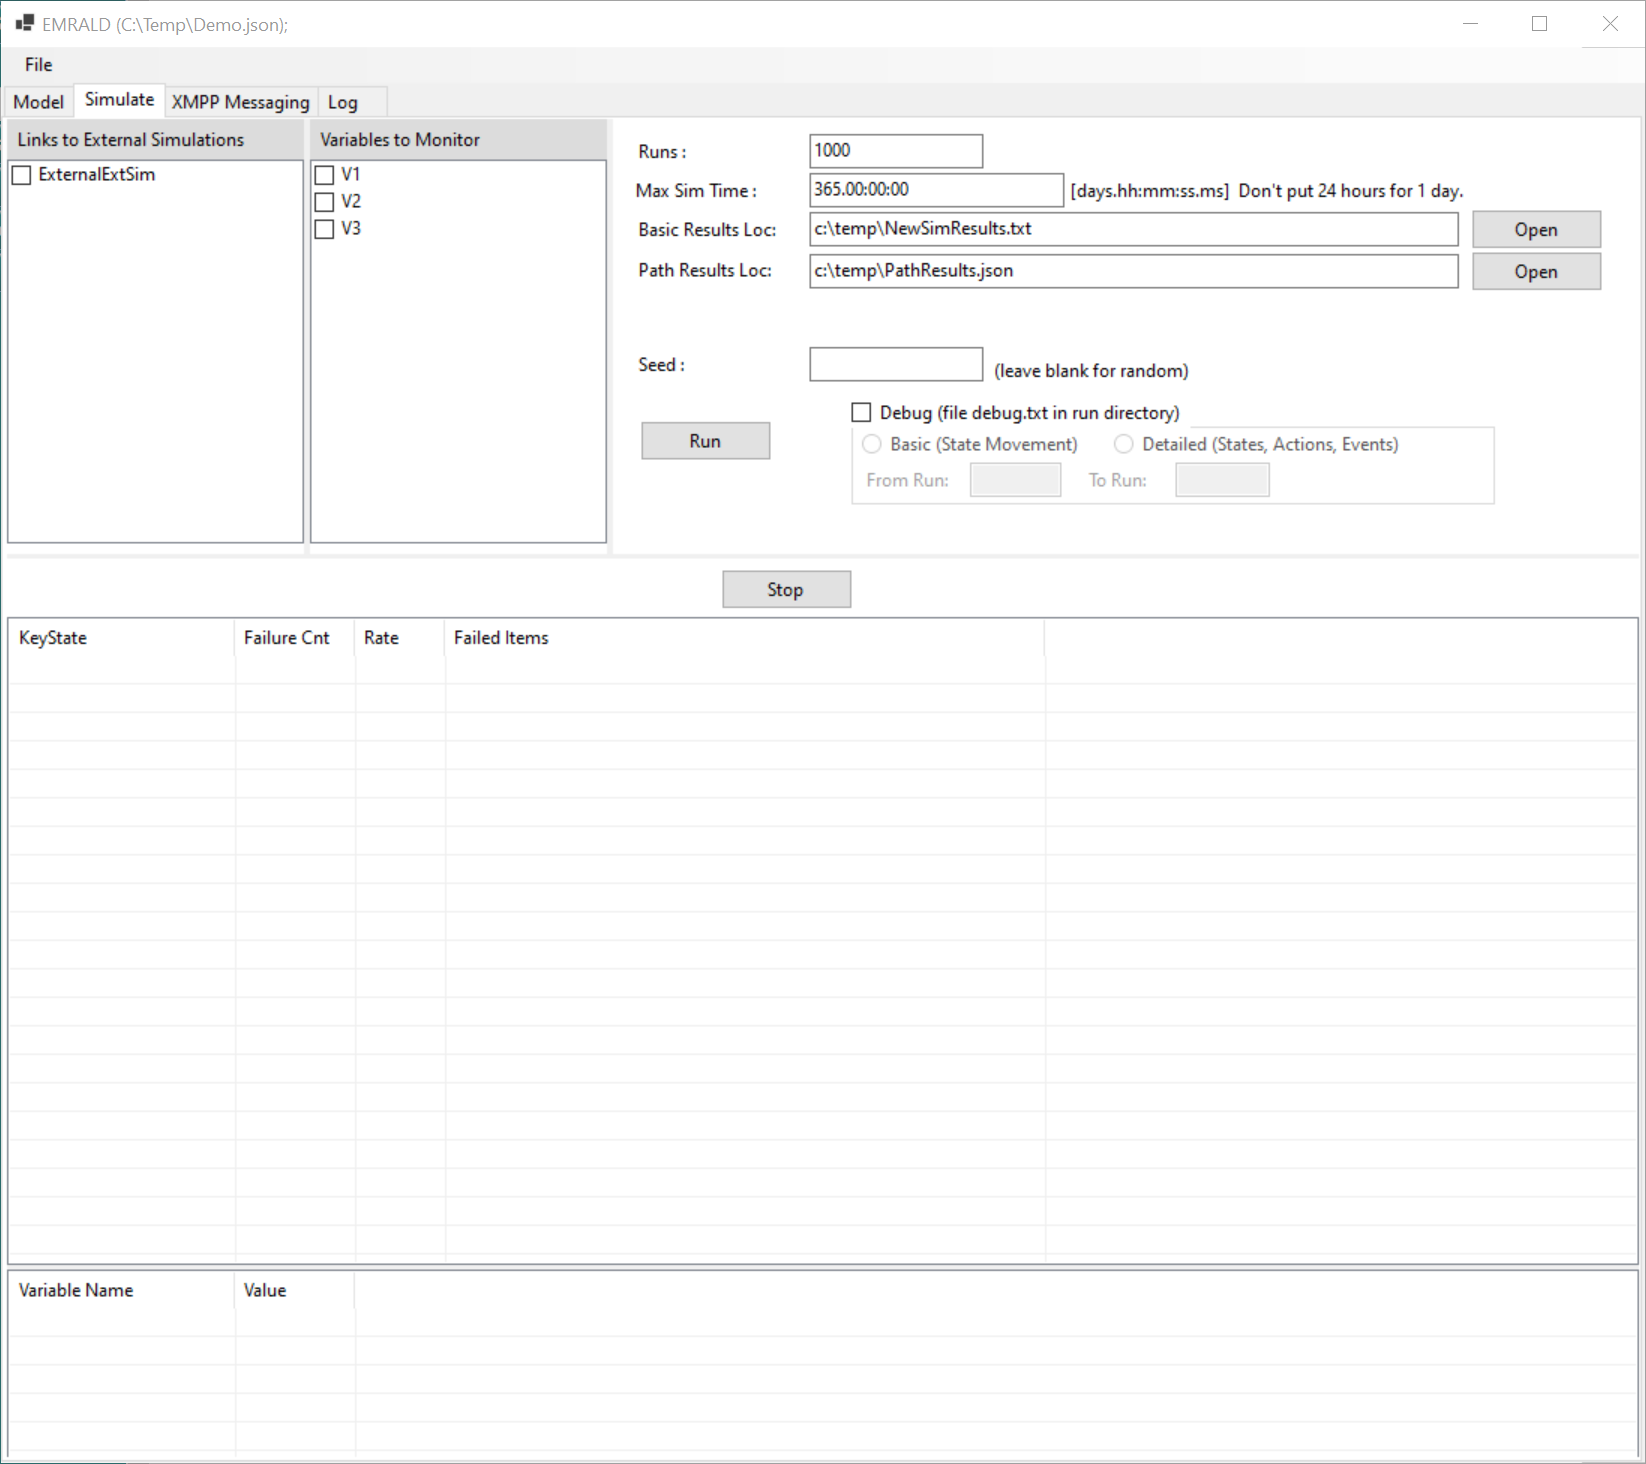
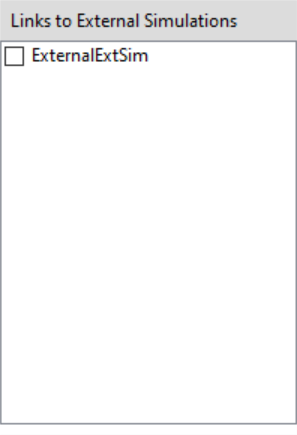
Links to External Simulations
Variables to Monitor
This window will display a checklist of all of the variables present in the model. If you check the box next to a variable, the value of that variable will be displayed in the lower result monitor as the simulation is running and at the end of each run will be saved into the output files. See the Results Monitors section for more information.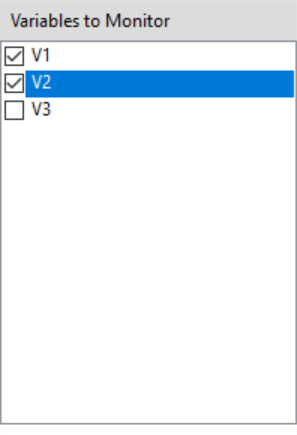
Simulation Controls
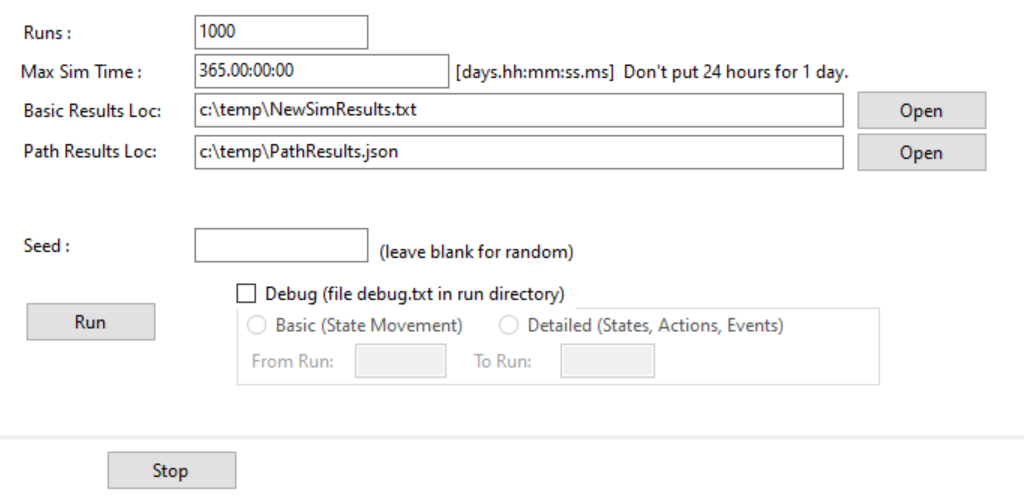
- Runs: The total number of runs, Start state to End state, you would like to simulate. The default value is 1000.
- Max Sim Time: The maximum total simulation time. This is not computing time. The format for entering simulation time is [days.hh:mm:ss.ms]. Do not put 00.24:00:00 for one day, put 1.00:00:00. The default value is 365.00:00:00.
- Basic Reults Loc: The directory location of the basic results. The default location and title of the text file is c:\temp\NewSimResults.txt. This can be changed directly in the field where the default path is shown or you can click "Open" to use a file explorer to navigate to the location you would like to save your file in. See Basic Results for more information on the actual results file.
- Path Results Loc: The directory location of the basic results. The default location and title of the text file is c:\temp\NewSimResults.txt. This can be changed directly in the field where the default path is shown or you can click "Open" to use a file explorer to navigate to the location you would like to save your file in. See Path Results for more information on the actual results file.
- Seed: You can prescribe a seed for consistent results or leave it blank for a random seed to be generated.
- Debug: Check the box to have a file saved for debugging your model. You can select either the radio button for a Basic debug file or a Detailed debug file which will record either just the movement from states or also include the actions and events triggered. You can also define which runs you would like to have the file output for. Indexing starts at 1 and the default entry is, "From Run: 1 To Run: [Number of Runs]". See Debug File for more information on the file that is generated from selecting this option.
- Run: Once all of your settings are complete, click this button to begin running the simulation.
- Stop: If you would like to stop the simulation prematurely, click this button.
Results Monitors
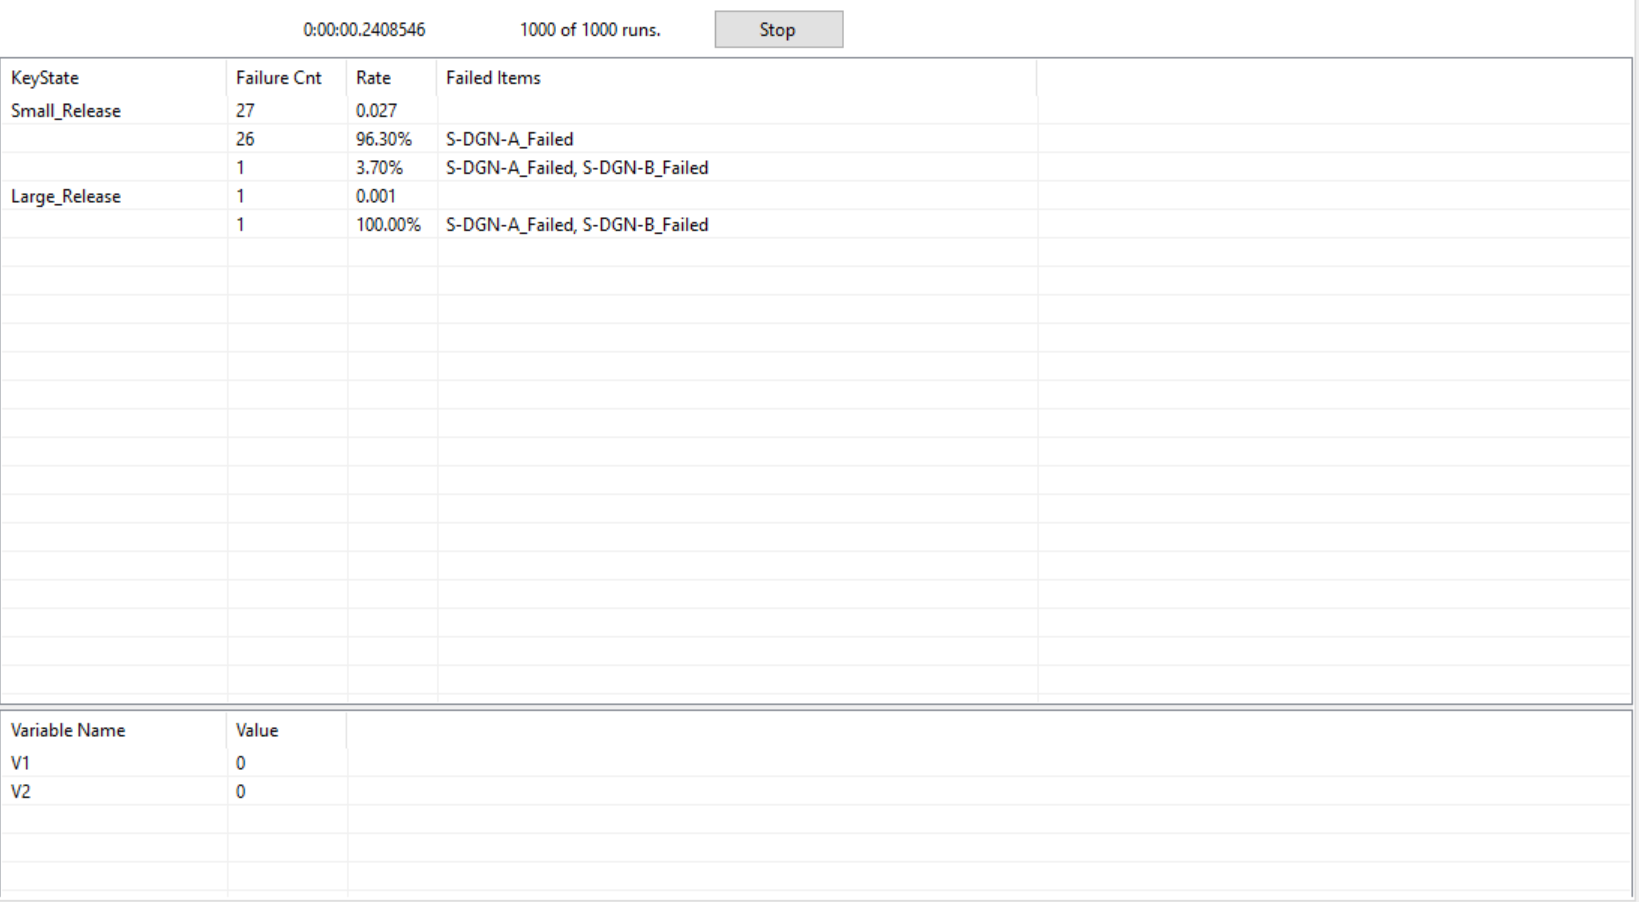
The top bar displays the computational run time, physical time for the model to compute, and the number of runs completed of the total number of runs prescribed for the simulation.
The upper window displays preliminary basic results. This monitor will update at the end of each run. The results shown are not minimal cutsets because they are not mutually exclusive. It displays any and all key states that were occupied at the end of the run. Below are descriptions of what is contained in each column of each entry. 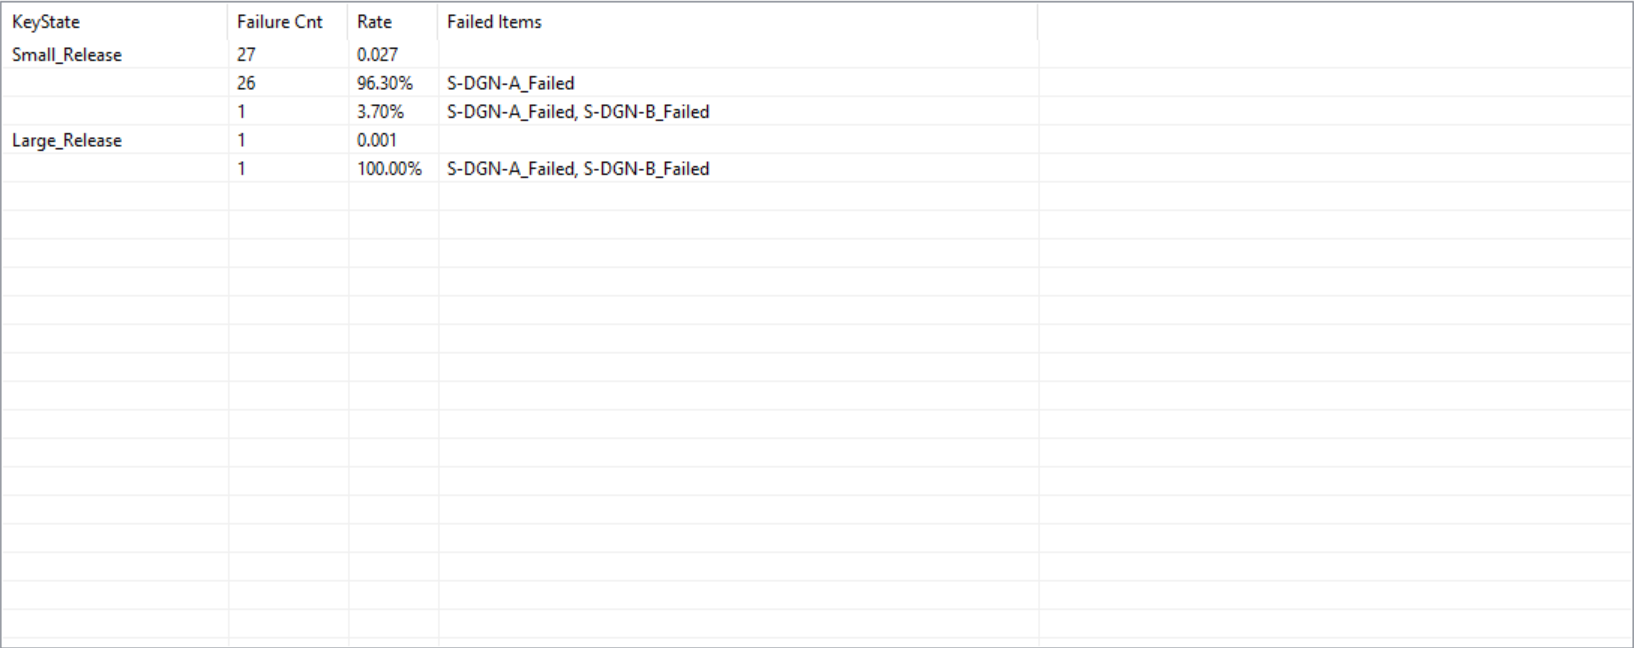
- Key State: The name of the key state that was reached at the end of the simulation.
- Failure Count: The number of times/runs this key state was reached in. The top row will contain the total failure count. The succeeding rows will contain the failure count for each particular scenario.
- Rate: The failure rate in percent. The top row will contain the rate for all times the key state was reached. The succeeding rows will contain the failure rate for each particular scenario. Because these numbers update at the end of each run, the rate is calculated by the failure count over the number of runs completed. Not the total number of runs to be completed.
- Failed Items: This is a list of all states with a "False" value reached when the key state was reached. They may not necessarily directly contribute to leading to that key state.
The lower window monitors the variables checked in the Variables to Monitor section of the Simulate tab. This monitor will update in live simulation time. 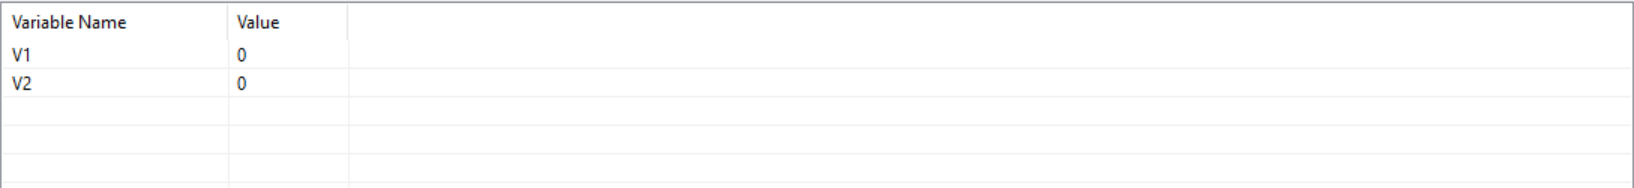
- Variable Name: The name of the variable.
- Value: The current value of that variable.
XMPP Messaging Tab
Connected Clients
Message Log
- Checkbox for Clear Sim Start
Send Manual Event Message
- DispName:
- Description
- Sim Time:
- Action Msg Type:
- CompModify
- Timer
- OpenSim
- CancelSim
- PauseSim
- Continue
- Reset
- RestartAtTime
- Ping
- Status
- Time:
- Item Data
- Name ID:
- Value:
- Info (likely JSON)
- Generate Message button
- Send to: and Send button
Log Tab
Output Files
From the simulation, three different kinds of files can be output: Basic Results, Path Results, and an optional Debug file. The structure and content of each will be further explained in the following sections. See more on the file location references in Backend Information.
Basic Results
The basic results will dispaly all of the same results that were displayed in the upper and lower monitor windows of the solver GUI. This file will be updated as the simulation is running. Below is a breakdown of the content contained in the order it is written to the file.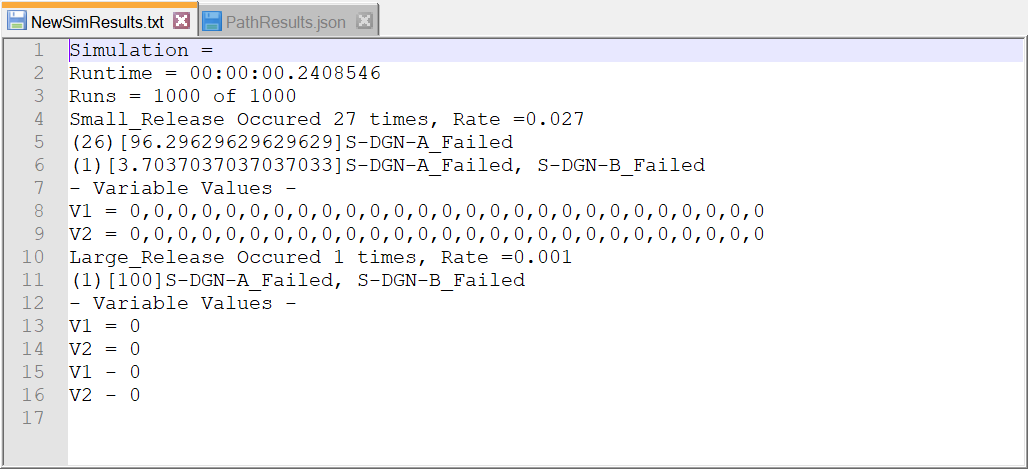
Simulation: Name of the model when it was first created from "New". This example does not have a name because it is the demonstration model that is loaded by default into the EMRALD model editor.
Runtime: The simulation run time. This is not the physical computation time. It is in the format: [days.hh:mm:ss.ms].
Runs: The number of runs completed out of the number of runs prescribed for the simulation. It is in the format: [Number of Runs Completed] of [Total Number of Runs].
Key States: There is a block entry for each key state. It first includes the name of the Key State, number of occurances and Rate structured like this:
[Key State Name] Occured [Failure Count] times, Rate = [Failure Rate]The following lines will be a breakdown of all the different scenarios, combinations of failed items. Each entry is structured like this:
(Failure Count)[Failure Rate in %] Failed Item #1, Failed Item #2, ... Failed Item #nThen there will be a section of - Variable Values - where each variable that was checked off to be monitored in the solver GUI will be listed and the value of that variable at the end of each run will be listed. Each entry is structured like this:
[Variable Name] = [Value at end of Run #1], [Value at end of Run #2], ... [Value at end of Run #n]The values from the very last run of the simulation will be listed again in a separate set of rows.
Path Results
The path results will display the paths taken to arrive at each key state reached. This will include nested entries for each movement between states for each cause path for each key state. It is structured as shown below.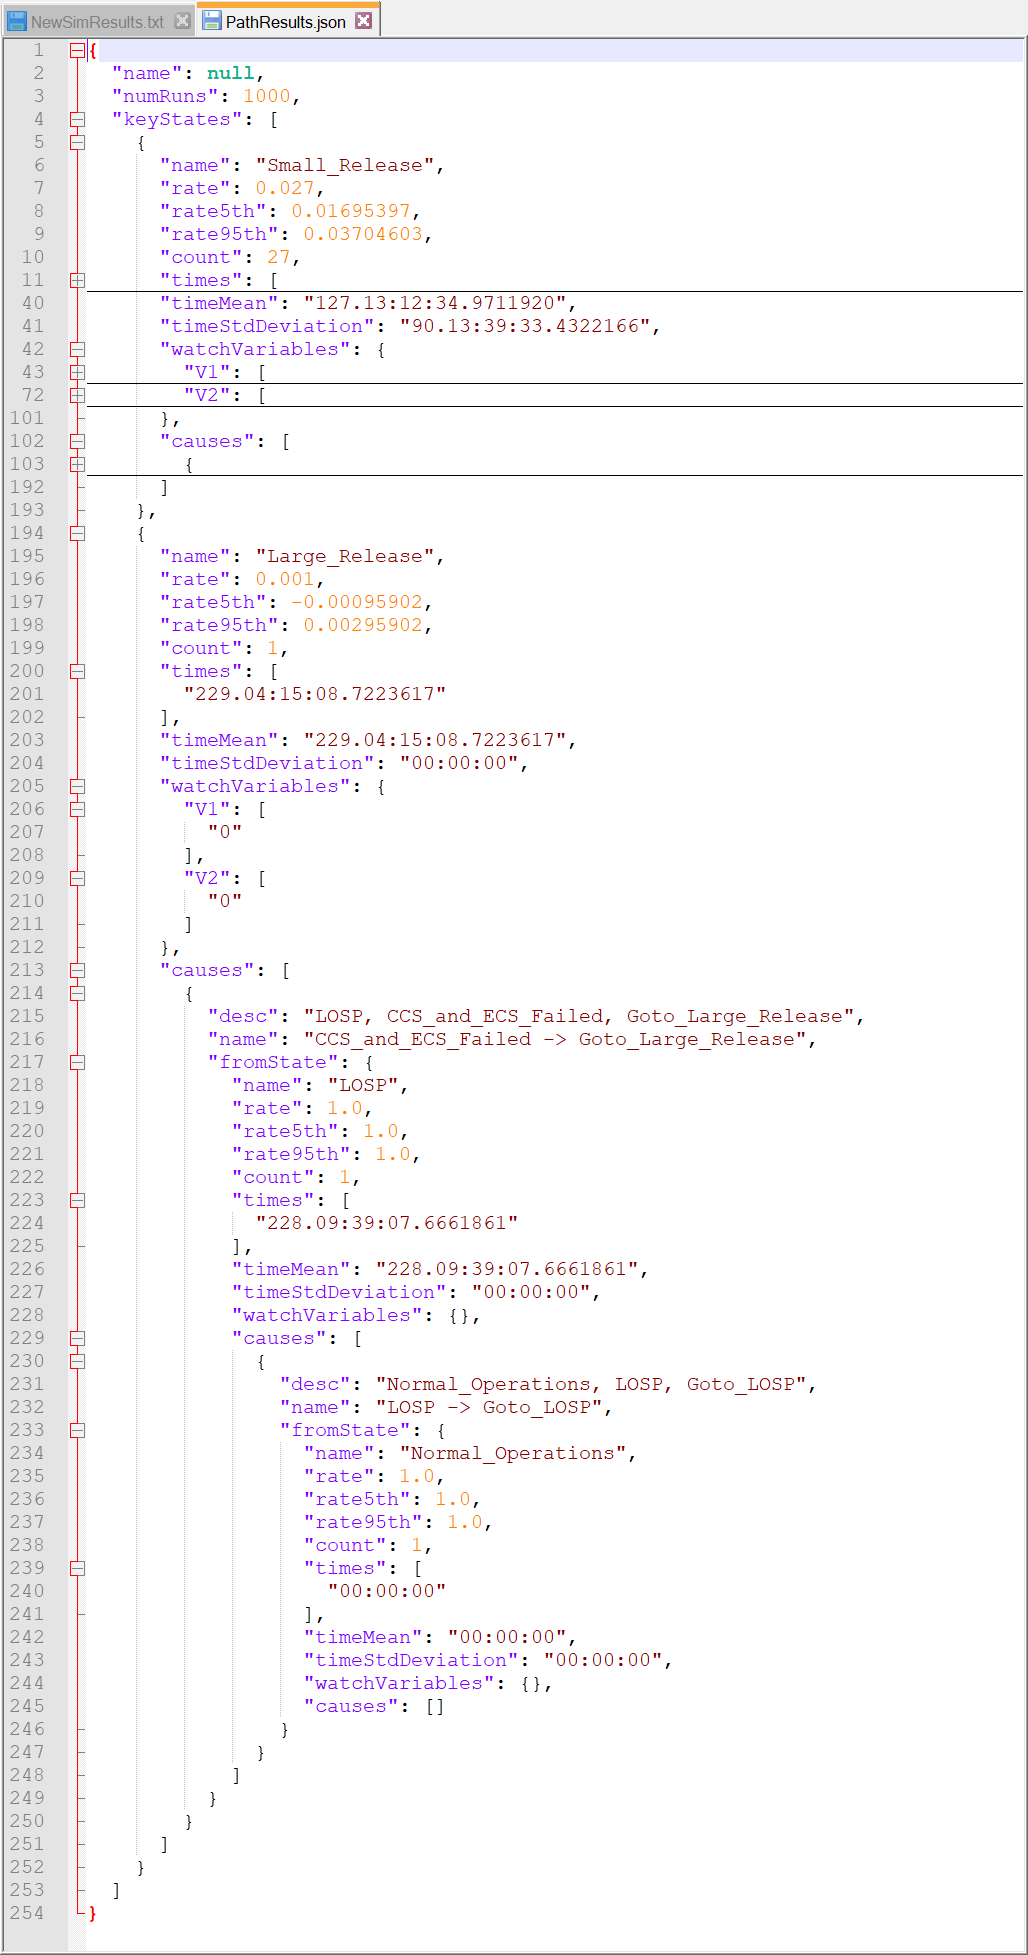
"name": Name of the model when it was first created from "New". This example does not have a name because it is the demonstration model that is loaded by default into the EMRALD model editor.
"numRuns": The number of runs completed.
"keyStates": Each key state will have a header entry that is structured like the following:
"name": Name of the key state
"rate": The failure rate which is the total number of times the key state was reached over the total number of runs.
"rate5th": The fifth percentile of the failure rate for this key state.
"rate95th": The ninety-fifth percentile of the failure rate for this key state.
"count": The failure count or number of times this key state was reached.
"times": This lists for each run the key state was reached, the time to failure or amount of simulation time it took to reach the key state.
"timeMean": The mean time to failure of all the times listed.
"timeStdDeviation": The standard deviation of all the times listed.
"watchVariables": A list of all variables and their values at the end of each run when the key state was reached. It is strucutred like this:
  "Variable1": [
      "Value at end of first run key state was reached",
      "Value at end of second run key state was reached",
      .
      .
      .
      "Value at end of n-th run key state was reached",
  ],
  "Variable2": [
      "Value at end of first run key state was reached",
      "Value at end of second run key state was reached",
      .
      .
      .
      "Value at end of n-th run key state was reached",
  ],
"causes:" After the header is the "causes" section which is a cascading list or lists of state transitions that occured in reverse order to lead to the key state. Each list entry will be structured as shown below.
"desc": "State, Event, Action", *Note- the state that this entry is for and the event and action that was triggered in this state that led to the state one entry above
"name": "Event, Action", *Note- same event and action in the description section
"fromState: {
"name": "State", *Note- same state in the description section
"rate": The total number of times the key state was reached over the total number of runs. "rate5th": The fifth percentile of the rate for this state.
"rate95th": The ninety-fifth percentile of the rate for this state.
"count": The number of times this state was reached via the path in the description.
"times": This lists for each run the state was reached, the amount of simulation time it took to reach the state via the path in the description.
"timeMean": The mean time of all the times listed.
"timeStdDeviation": The standard deviation of all the times listed.
"watchVariables": A list of all variables and their values when the state was reached. It is strucutred in the same way as the "watchVariables" section for the key state header.
Debug File
This file is optionally generated. More information on how to choose this to be generated is in the Simulation Controls section.
Once generated, the file is saved in a sub-directory in your EMRALD directory at this location: \EMRALD\EMRALD_Sim\bin\Debug\netcoreapp3.1.
Depending on which selection was chosen, it can either be a basic or detailed debug file.
The basic file contains all state movement that occured within the prescribed range of runs and is structured like the following for each run:
StartRun: [The number of the run]
EnterState: [Name of state entered], time: [Simulation time it entered], Cause Event: [Event that caused the state to be entered], fromState-Action: [Action that caused the state to be entered]
ExitState: [Name of state exited]
.
.
.
EndOfRun: [The number of the run]
The detailed file contains all state movement, events triggered, and actions taken. It has the same structure for entered states but will now also provide the event and action (if applicable) that leads to an exited state. That is structured like the following.
DoEvent: [The event that was triggered]
DoTransitionAction: [The transition action triggered from the event that causes a state to be exited]
ExitState: [Name of the state exited]